HoloHawk earns a commission on eBay purchases through this link. It never changes the price you pay.
Prices by grade
Today's figures for every tier. Raw is the HoloHawk price above; graded tiers are PriceCharting, converted to GBP.
Raw · ungraded£1.17
PSA 10£26.14
PSA 9£8.45
CGC 10£10.49
BGS 10£33.71
At a glance
Days tracked37
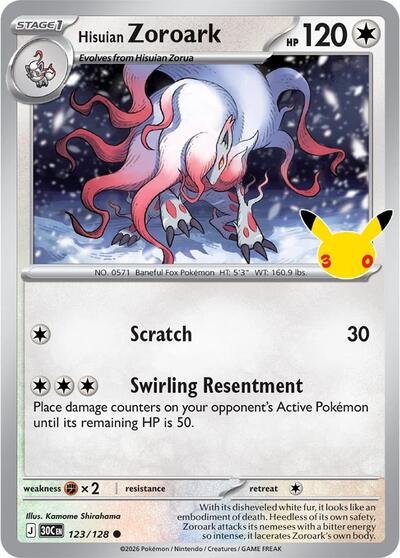
IllustratorKamome Shirahama
Price history
13 readings · 37d
£1.17HoloHawk£0.76-13.6%PriceChartingPulseTCG awaiting data
20 Sept 2026HoloHawk£1.1718 Oct 2026HoloHawk£1.17PriceCharting£0.8819 Oct 2026HoloHawk£1.17PriceCharting£1.0020 Oct 2026HoloHawk£1.17PriceCharting£1.0021 Oct 2026HoloHawk£1.17PriceCharting£1.0022 Oct 2026HoloHawk£1.17PriceCharting£1.0023 Oct 2026HoloHawk£1.17PriceCharting£0.7424 Oct 2026HoloHawk£1.17PriceCharting£0.7425 Oct 2026HoloHawk£1.17PriceCharting£0.76
£0.80£1.00
18 Oct19 Oct19 Oct23 Oct23 Oct25 Oct
£1.17HoloHawk£0.76-65.6%PriceChartingPulseTCG awaiting data
18 Sept 2026PriceCharting£2.2119 Sept 2026PriceCharting£2.2120 Sept 2026HoloHawk£1.17PriceCharting£2.2121 Sept 2026HoloHawk£1.17PriceCharting£2.2122 Sept 2026HoloHawk£1.17PriceCharting£0.1623 Sept 2026HoloHawk£1.17PriceCharting£0.8224 Sept 2026HoloHawk£1.17PriceCharting£0.8225 Sept 2026HoloHawk£1.17PriceCharting£0.9026 Sept 2026HoloHawk£1.17PriceCharting£0.8227 Sept 2026HoloHawk£1.17PriceCharting£0.7128 Sept 2026HoloHawk£1.17PriceCharting£0.7529 Sept 2026HoloHawk£1.17PriceCharting£0.6930 Sept 2026HoloHawk£1.17PriceCharting£0.691 Oct 2026HoloHawk£1.17PriceCharting£0.692 Oct 2026HoloHawk£1.17PriceCharting£0.753 Oct 2026HoloHawk£1.17PriceCharting£0.754 Oct 2026HoloHawk£1.17PriceCharting£0.755 Oct 2026HoloHawk£1.17PriceCharting£0.756 Oct 2026HoloHawk£1.17PriceCharting£0.757 Oct 2026HoloHawk£1.17PriceCharting£0.758 Oct 2026HoloHawk£1.17PriceCharting£0.759 Oct 2026HoloHawk£1.17PriceCharting£0.7510 Oct 2026HoloHawk£1.17PriceCharting£0.7511 Oct 2026HoloHawk£1.17PriceCharting£0.7512 Oct 2026HoloHawk£1.17PriceCharting£0.7513 Oct 2026HoloHawk£1.17PriceCharting£0.7514 Oct 2026HoloHawk£1.17PriceCharting£0.7515 Oct 2026HoloHawk£1.17PriceCharting£0.8816 Oct 2026HoloHawk£1.17PriceCharting£0.8817 Oct 2026HoloHawk£1.17PriceCharting£0.8818 Oct 2026HoloHawk£1.17PriceCharting£0.8819 Oct 2026HoloHawk£1.17PriceCharting£1.0020 Oct 2026HoloHawk£1.17PriceCharting£1.0021 Oct 2026HoloHawk£1.17PriceCharting£1.0022 Oct 2026HoloHawk£1.17PriceCharting£1.0023 Oct 2026HoloHawk£1.17PriceCharting£0.7424 Oct 2026HoloHawk£1.17PriceCharting£0.7425 Oct 2026HoloHawk£1.17PriceCharting£0.76
£1.00£2.00
18 Sept23 Sept27 Sept29 Sept19 Oct25 Oct
Three independent readings on one scale. A reading is recorded only when a price changes, so a flat stretch means it held. Hover or tap any day. PulseTCG has no readings for this card yet.
18 Sept 2026PSA 10£37.38PSA 9£11.31CGC 10£22.48BGS 10£48.7019 Sept 2026PSA 10£37.38PSA 9£11.31CGC 10£22.48BGS 10£48.7020 Sept 2026PSA 10£37.38PSA 9£11.31CGC 10£22.48BGS 10£48.7021 Sept 2026PSA 10£37.38PSA 9£11.31CGC 10£22.48BGS 10£48.7022 Sept 2026PSA 10£23.30PSA 9£7.70CGC 10£14.23BGS 10£29.9723 Sept 2026PSA 10£23.30PSA 9£7.70CGC 10£14.23BGS 10£29.9724 Sept 2026PSA 10£23.30PSA 9£7.70CGC 10£14.23BGS 10£29.9725 Sept 2026PSA 10£26.59PSA 9£8.55CGC 10£15.73BGS 10£34.4626 Sept 2026PSA 10£26.96PSA 9£8.65CGC 10£16.48BGS 10£35.2127 Sept 2026PSA 10£26.54PSA 9£8.54CGC 10£15.73BGS 10£34.4628 Sept 2026PSA 10£26.02PSA 9£8.41CGC 10£15.73BGS 10£33.7129 Sept 2026PSA 10£26.21PSA 9£8.45CGC 10£15.73BGS 10£33.7130 Sept 2026PSA 10£26.21PSA 9£8.45CGC 10£15.73BGS 10£33.711 Oct 2026PSA 10£26.21PSA 9£8.45CGC 10£15.73BGS 10£33.712 Oct 2026PSA 10£25.91PSA 9£8.38CGC 10£15.73BGS 10£33.713 Oct 2026PSA 10£25.91PSA 9£8.38CGC 10£15.73BGS 10£33.714 Oct 2026PSA 10£25.91PSA 9£8.38CGC 10£15.73BGS 10£33.715 Oct 2026PSA 10£25.91PSA 9£8.38CGC 10£15.73BGS 10£33.716 Oct 2026PSA 10£25.91PSA 9£8.38CGC 10£15.73BGS 10£33.717 Oct 2026PSA 10£25.91PSA 9£8.38CGC 10£15.73BGS 10£33.718 Oct 2026PSA 10£25.91PSA 9£8.38CGC 10£15.73BGS 10£33.719 Oct 2026PSA 10£25.91PSA 9£8.38CGC 10£15.73BGS 10£33.7110 Oct 2026PSA 10£25.91PSA 9£8.38CGC 10£15.73BGS 10£33.7111 Oct 2026PSA 10£25.91PSA 9£8.38CGC 10£15.73BGS 10£33.7112 Oct 2026PSA 10£25.91PSA 9£8.38CGC 10£15.73BGS 10£33.7113 Oct 2026PSA 10£25.91PSA 9£8.38CGC 10£15.73BGS 10£33.7114 Oct 2026PSA 10£25.91PSA 9£8.38CGC 10£15.73BGS 10£33.7115 Oct 2026PSA 10£26.19PSA 9£8.46CGC 10£15.73BGS 10£33.7116 Oct 2026PSA 10£26.19PSA 9£8.46CGC 10£15.73BGS 10£33.7117 Oct 2026PSA 10£26.19PSA 9£8.46CGC 10£15.73BGS 10£33.7118 Oct 2026PSA 10£26.19PSA 9£8.46CGC 10£15.73BGS 10£33.7119 Oct 2026PSA 10£27.96PSA 9£8.92CGC 10£16.48BGS 10£36.7120 Oct 2026PSA 10£27.96PSA 9£8.92CGC 10£16.48BGS 10£36.7121 Oct 2026PSA 10£27.96PSA 9£8.92CGC 10£16.48BGS 10£36.7122 Oct 2026PSA 10£27.96PSA 9£8.92CGC 10£16.48BGS 10£36.7123 Oct 2026PSA 10£27.41PSA 9£8.78CGC 10£11.24BGS 10£35.9624 Oct 2026PSA 10£27.41PSA 9£8.78CGC 10£11.24BGS 10£35.9625 Oct 2026PSA 10£26.14PSA 9£8.45CGC 10£10.49BGS 10£33.71
£20.00£40.00
18 Sept23 Sept27 Sept29 Sept19 Oct25 Oct
Graded prices from PriceCharting, in GBP. PSA 10 has been tracked since April 2026; the other tiers began recording 3 August 2026 and join the chart as their history builds.
New listings per day
0 today
How many new UK listings appear for this card each day. Rising supply against a
falling price is the clearest sell signal there is. This counts what we saw, so it is a sample of
the market rather than a total.
16 Sept 2026New listings/day2817 Sept 2026New listings/day518 Sept 2026New listings/day019 Sept 2026New listings/day020 Sept 2026New listings/day221 Sept 2026New listings/day122 Sept 2026New listings/day023 Sept 2026New listings/day024 Sept 2026New listings/day025 Sept 2026New listings/day026 Sept 2026New listings/day127 Sept 2026New listings/day128 Sept 2026New listings/day029 Sept 2026New listings/day030 Sept 2026New listings/day01 Oct 2026New listings/day02 Oct 2026New listings/day03 Oct 2026New listings/day04 Oct 2026New listings/day05 Oct 2026New listings/day06 Oct 2026New listings/day07 Oct 2026New listings/day08 Oct 2026New listings/day09 Oct 2026New listings/day010 Oct 2026New listings/day011 Oct 2026New listings/day012 Oct 2026New listings/day013 Oct 2026New listings/day014 Oct 2026New listings/day015 Oct 2026New listings/day016 Oct 2026New listings/day017 Oct 2026New listings/day018 Oct 2026New listings/day019 Oct 2026New listings/day020 Oct 2026New listings/day021 Oct 2026New listings/day022 Oct 2026New listings/day023 Oct 2026New listings/day024 Oct 2026New listings/day025 Oct 2026New listings/day026 Oct 2026New listings/day0
01020
16 Sept29 Sept13 Oct26 Oct
New UK listings we saw appear each day. A direct count of what the scanner observed, not an estimate of everything on eBay. Source: HoloHawk, observed directly on eBay UK.
Confirmed sales per day
Building
How often this card actually sells We record roughly 4,600 UK auction outcomes a day across the catalogue. This charts how many close with a winning bid, day by day, from the first confirmed sale for this card.
Only auctions that finished with a bid count. A listing vanishing is not proof of a sale, so it is not counted as one.
Recent confirmed sales
Recording live
No confirmed sales for this card yet
We log every UK auction that closes with a winning bid — around 4,600 a day across the catalogue.
The first result for this card appears here as soon as one sells.
On sale now in the UK
4 live
Fixed-price listings we are currently tracking, cheapest first. Asking prices, not sales,
and a sample of what is listed rather than everything on eBay. Each row opens the listing on eBay — HoloHawk earns a commission on purchases made through it, and it never changes the price you pay.
Three independent readings, shown side by side rather than blended into one figure:
HoloHawkOur own market price, from live UK listings
PriceChartingPublished reference price, USD converted to GBP
PulseTCGPublished reference price, natively GBP
A reading is stored only when a price actually changes, so flat
stretches mean the price held — not that data is missing. Where a source has no history for an item its
line is absent rather than flat. Confirmed sales are UK auctions that closed with a winning bid, observed
within three minutes of close, so each is a lower bound. Live listings are asking prices, not sales.
Supply and sales counts are direct observations — listings we saw appear and auctions we saw close with a
bid. We do not infer that a listing sold because it disappeared, so nothing here depends on that guess.